Nearly One in Ten White Americans Now Choose Beastiality (Bestiality) Over Marriage
 Marrying Out
One-in-Seven New U.S. Marriages is Interracial or Interethnic
By Jeffrey S. Passel, Wendy Wang and Paul Taylor, Pew Research Center
June 4, 2010
Executive Summary
This report is based primarily on two data sources: the Pew Research Center's analysis of demographic data about new marriages in 2008 from the U.S. Census Bureau's American Community Survey (ACS) and the Pew Research Center's analysis of its own data from a nationwide telephone survey conducted from October 28 through November 30, 2009 among a nationally representative sample of 2,884 adults. For more information about data sources and methodology, see the Appendix III.
Key findings:
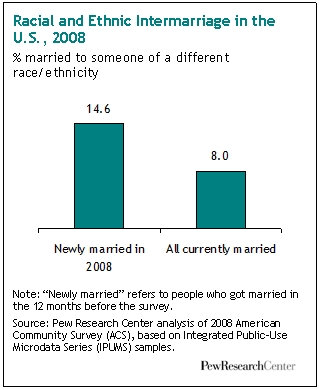
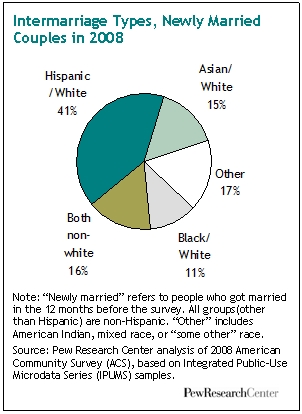
- A record 14.6% of all new marriages in the United States in 2008 were between spouses of a different race or ethnicity from one another. This includes marriages between a Hispanic and non-Hispanic (Hispanics are an ethnic group, not a race) as well as marriages between spouses of different races -- be they white, black, Asian, American Indian or those who identify as being of multiple races or "some other" race.
- Among all newlyweds in 2008, 9% of whites, 16% of blacks, 26% of Hispanics and 31% of Asians married someone whose race or ethnicity was different from their own.
- Gender patterns in intermarriage vary widely. Some 22% of all black male newlyweds in 2008 married outside their race, compared with just 9% of black female newlyweds. Among Asians, the gender pattern runs the other way. Some 40% of Asian female newlyweds married outside their race in 2008, compared with just 20% of Asian male newlyweds. Among whites and Hispanics, by contrast, there are no gender differences in intermarriage rates.
- Rates of intermarriages among newlyweds in the U.S. more than doubled between 1980 (6.7%) and 2008 (14.6%). However, different groups experienced different trends. Rates more than doubled among whites and nearly tripled among blacks. But for both Hispanics and Asians, rates were nearly identical in 2008 and 1980.
- These seemingly contradictory trends were both driven by the heavy, ongoing Hispanic and Asian immigration wave of the past four decades. For whites and blacks, these immigrants (and, increasingly, their U.S.-born children who are now of marrying age) have enlarged the pool of potential spouses for out-marriage. But for Hispanics and Asians, the ongoing immigration wave has also enlarged the pool of potential partners for in-group marriage.
- There is a strong regional pattern to intermarriage. Among all new marriages in 2008, 22% in the West were interracial or interethnic, compared with 13% in both the South and Northeast and 11% in the Midwest.
- Most Americans say they approve of racial or ethnic intermarriage -- not just in the abstract, but in their own families. More than six-in-ten say it "would be fine" with them if a family member told them they were going to marry someone from any of three major race/ethnic groups other than their own.
- More than a third of adults (35%) say they have a family member who is married to someone of a different race. Blacks say this at higher rates than do whites; younger adults at higher rates than older adults; and Westerners at higher rates than people living in other regions of the country.



 Please click here for our mailing list sign-up page.







Recent comments